Your shopping cart is empty!
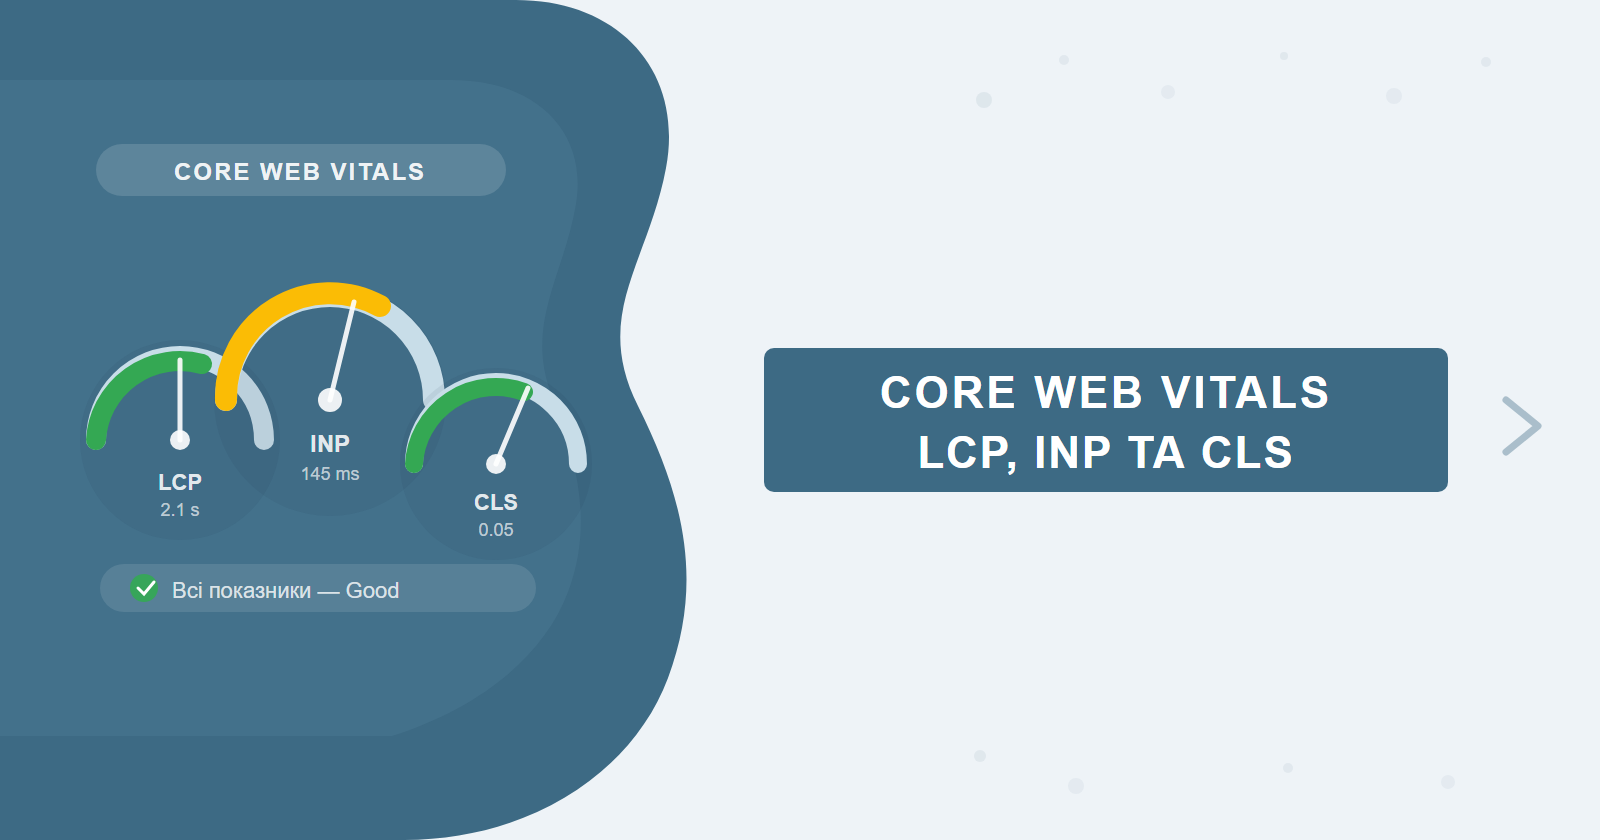
Since March 2024, Google replaced FID with INP — a metric that tracks not just the first interaction but every interaction throughout a session. If your site was optimized for the old metrics, some of that work is now outdated. Core Web Vitals remain a ranking signal, and poor scores create a real barrier to competing in top positions. This guide goes beyond checklists: it's a detailed technical breakdown of each metric with root causes, code examples, and real-world cases.
If you need help with technical optimization, the SEO-Factory team handles CWV as part of SEO website promotion. Current thresholds and methodology: web.dev/articles/vitals.
Contents
Metric Thresholds: What Counts as Good
Google evaluates each metric using real-user data (CrUX — Chrome User Experience Report) and looks at the 75th percentile: 75% of visits to your site need to fall in the green zone. If even one metric is in the "yellow" or "red" range, the page fails the Page Experience assessment.
Note: if your Google Search Console report has no CrUX data (new site or low traffic), Google doesn't apply the Page Experience signal to your pages — but PageSpeed Insights will still show Lighthouse lab data.
How to Check Your Core Web Vitals
There are two data types: field data (real users, CrUX) and lab data (Lighthouse, simulation). Google uses only field data for ranking, but lab data helps reproduce and pinpoint problems.
| Tool | Data type | When to use |
|---|---|---|
| PageSpeed Insights | Field + lab | Quick check on a specific URL |
| Google Search Console (Core Web Vitals) | Field | Site-wide overview, URL grouping |
| Chrome DevTools → Performance | Lab | Profiling specific problems |
| Lighthouse CI | Lab | Automated monitoring in CI/CD |
| CrUX Dashboard (Looker Studio) | Field | Trend analysis over 28-day windows |
| WebPageTest | Lab + waterfall | Deep resource loading analysis |
Tip: start with GSC — it shows which page templates have issues (product cards, articles, landing pages). PageSpeed Insights checks one URL at a time; GSC gives you the full picture across the entire site.
LCP: Deep Dive
What exactly is the LCP element
LCP (Largest Contentful Paint) measures when the largest visible content element in the viewport finishes loading. The browser considers the following as LCP candidates:
- Images —
<img>, elements inside<picture>, or CSSbackground-image(under certain conditions) - Video poster — the
posterattribute of a<video>element - Text blocks —
<h1>,<p>,<div>with substantial text content, if they are the largest elements in viewport - SVG containing
<image>— rare, but counted
In practice, for most commercial sites the LCP element is the hero image at the top of the page. For blogs — typically the first <h1> or a large article illustration. To identify the exact element: Chrome DevTools → Performance → record a session → find the LCP event in the Timings track. PageSpeed Insights also highlights it with a screenshot.
LCP > 4 seconds is not just a bad metric. It means the user is staring at an unloaded page for four seconds. Google's data shows 53% of mobile users abandon a site if it takes more than 3 seconds to load. The site may rank, but conversions drop long before the SEO metric turns red.
Top 5 causes of poor LCP and their fixes
1. LCP image has no preload in <head>
The browser doesn't know about the LCP image's importance until it parses the HTML and finds the <img> tag — which can take hundreds of milliseconds. The fix is an explicit preload:
<link rel="preload" as="image"
  href="/hero.webp"
  fetchpriority="high">
For responsive images, use imagesrcset and imagesizes on the same preload tag. The fetchpriority="high" attribute (supported since Chrome 102) further elevates the resource in the browser's fetch queue.
2. Render-blocking resources block the first paint
CSS and synchronous JavaScript in <head> block the parser — the page won't render until they're downloaded and executed. Fixes:
- Critical CSS (above-the-fold styles) — inline directly in
<head> - Non-critical CSS — defer via
<link rel="preload" as="style" onload="this.rel='stylesheet'"> - JavaScript — use
deferortype="module"; synchronous JS in<head>is the single biggest LCP killer
3. Wrong lazy loading on the LCP element
The loading="lazy" attribute tells the browser to wait before fetching an image. If it's on your hero image — that's a direct cause of poor LCP, easy to miss in CMS templates. Check: PageSpeed Insights will show a "Defer offscreen images" warning — if your LCP element appears there, that's a bug.
4. High TTFB (Time to First Byte)
If the server responds slowly, LCP can't be good by definition. TTFB > 800 ms is critical. Causes: slow hosting, no caching, heavy database queries. Solutions: CDN (Cloudflare, Fastly), Redis caching, HTTP/2 or HTTP/3, server-side rendering instead of client-side for important pages.
5. Unoptimised image format and size
1–3 MB JPEG/PNG images are a systemic problem. WebP delivers 25–34% smaller files at equivalent quality. AVIF is even more efficient but not universally supported. The correct implementation:
<picture>
  <source srcset="/hero.avif" type="image/avif">
  <source srcset="/hero.webp" type="image/webp">
  <img src="/hero.jpg" alt="Hero" width="1200" height="600"
       fetchpriority="high">
</picture>
The width and height attributes are mandatory — they allow the browser to reserve space before the image loads (which also improves CLS).
Special case — fonts and LCP: if your LCP element is text (like a large H1), using
font-display: optional ensures the browser won't wait for a custom font to load. If the font isn't cached — the system font renders, and LCP is unaffected.INP: Deep Dive
INP vs FID: the fundamental difference
FID (First Input Delay) only measured the delay of the very first interaction — typically a click right after page load, when the browser is most loaded. INP (Interaction to Next Paint) is fundamentally different: it tracks all interactions throughout the session (clicks, keypresses, taps) and captures the worst one. FID could show green on a site that was fine at load time but lagged on filter clicks mid-session. INP won't miss that.
Technically, INP measures interaction latency — the time from an interaction start to the next paint that reflects visual feedback. This latency has three components: input delay (time from event to handler start), processing time (event handler execution), and presentation delay (time from JS completion to next frame).
Long Tasks and their role in poor INP
The browser's main thread handles everything: HTML parsing, JavaScript execution, layout, paint. JavaScript is single-threaded — and if any script occupies the main thread for > 50 ms, that's a Long Task. During a Long Task, the browser can't process user input events. The result: the user clicks, the browser "doesn't respond" for 200–800 ms — and that's captured as poor INP.
How to profile INP in Chrome DevTools
Open the page → Chrome DevTools → Performance tab → click Record → perform an interaction (button click, dropdown open, form submit) → stop recording. On the Main track, look for orange blocks with a red corner — those are Long Tasks. Clicking a block reveals the call stack: exactly which script and function caused the delay.
The Performance Insights tab in DevTools is even more convenient — it surfaces the top interactions by latency and breaks them down into input delay, processing time, and presentation delay.
On one e-commerce project (~80k visitors/month), INP was 680 ms due to a popular jQuery slider plugin that performed a full re-render on every click. After migrating to CSS animation, INP dropped to 140 ms. Rankings on transactional queries improved 8–12% over two months.
Concrete INP optimizations
Debouncing event handlers: if a handler fires on every keystroke or scroll pixel — that's a guaranteed Long Task. Use debounce or throttle:
function debounce(fn, delay) {
  let timer;
  return (...args) => {
    clearTimeout(timer);
    timer = setTimeout(() => fn(...args), delay);
  };
}
input.addEventListener('input', debounce(handleSearch, 300));
Web Workers for heavy computations: if the page sorts large arrays, processes images, or parses data — move it to a Web Worker running in a separate thread:
const worker = new Worker('heavy-task.js');
worker.postMessage({ data: largeArray });
worker.onmessage = (e) => renderResult(e.data);
scheduler.yield() to break up Long Tasks:
async function processLargeList(items) {
  for (let i = 0; i < items.length; i++) {
    processItem(items[i]);
    // Yield control every 50 items
    if (i % 50 === 0) await scheduler.yield();
  }
}
Defer third-party scripts: Google Analytics, Facebook Pixel, Hotjar, LiveChat — each can add 50–200 ms to INP. Load them after the load event via requestIdleCallback.
Tip: INP varies heavily by device. Test on a real mid-range Android phone (Moto G Power, Samsung A-series), not just DevTools emulation. Poor INP on desktop is often invisible, but critical for mobile users — who typically make up the majority of traffic in most niches.
CLS: Deep Dive
What causes layout shifts
CLS (Cumulative Layout Shift) accumulates scores for all unexpected element shifts during page load and use. Each shift is scored using the formula: Impact Fraction × Distance Fraction.
Impact Fraction is the portion of the viewport occupied by the shifted element (and the space it occupied before). Distance Fraction is how far it moved as a fraction of the viewport height. Example: a banner occupies 50% of viewport height and shifts 25% downward → 0.5 × 0.25 = 0.125 for a single shift.
| Cause | Typical symptom | Fix |
|---|---|---|
| Images without dimensions | Content jumps down when image loads | Explicit width and height, CSS aspect-ratio |
| Ad banners without reserved space | Banner appears above content after load | min-height on container before load |
| FOUT/FOIT (font loading) | Text re-renders, lines shift | font-display: optional or swap |
| Dynamically injected content | Cookie banner, popup appear with delay | Render before load or anchor at bottom |
| CSS animations via top/left/margin | Elements move and affect neighbours | Replace with transform: translate() |
CLS fixes: concrete techniques
Explicit dimensions and CSS aspect-ratio:
/* Reserve space for a 16:9 image */
.hero-image {
  aspect-ratio: 16 / 9;
  width: 100%;
  object-fit: cover;
}

/* Or via HTML attributes (browser computes ratio) */
<img src="hero.webp" width="1200" height="675" alt="Hero">
Font-display: optional vs swap: optional is stricter — if the font isn't loaded within 100 ms, the browser uses the system font and never attempts to swap. Layout shift is impossible by definition. swap is softer — shows the system font first, then swaps when the custom font loads. A small shift is possible but minimal with correct font size adjustment.
Animation tip: animations using
transform and opacity run on the GPU and don't affect layout. Animations via top, left, margin, width, height always trigger reflow. Check in Chrome DevTools → Rendering → Layout Shift Regions to see shift rectangles in real time.Measurement Tools: Lighthouse vs CrUX
Field data vs lab data: why they diverge
Lighthouse (lab data): runs on an isolated machine with simulated 4G and Moto G4 CPU throttling. One simulation, clean cache, ideal conditions.
CrUX (field data): an aggregate of real visits over the past 28 days, including old devices, slow 3G connections, cached and uncached pages, browser extensions. If 30% of your audience is on slow Android phones — CrUX will show it; Lighthouse won't.
| Parameter | Lighthouse | CrUX (GSC / PSI) |
|---|---|---|
| Data source | Simulation (1 run) | Real users (28 days) |
| Stability | Varies between runs | Stable aggregation |
| Ranking impact | No | Yes (Page Experience) |
| Problem diagnostics | Detailed (waterfall, screenshots) | Limited |
| Minimum traffic | Not required | ~1,000 origins in CrUX |
Interpreting the GSC Core Web Vitals report
GSC groups URLs by template (e.g., "all product pages" or "all blog articles") and shows status: Good, Needs Improvement, Poor. The status is based on the 75th percentile of the group. Clicking a group reveals specific URL examples — open these in PageSpeed Insights for a detailed Lighthouse report with actionable recommendations.
WebPageTest: waterfall analysis
WebPageTest is the most powerful free tool for deep analysis. The waterfall diagram shows the loading sequence of every resource. For LCP optimization, look for: LCP image loading late (requests before it that shouldn't be in the critical path), long TTFB (the green bar on the first request), CSS or JS with long blocking time.
Tip: in WebPageTest, run tests from a location close to your audience and choose a real device over emulation — this gives the most accurate results.
CWV Impact on Rankings: Real Cases
A Searchmetrics study in 2021 found correlation between Core Web Vitals and rankings — but correlation doesn't mean causation. Google itself emphasises: CWV is one of many ranking factors, and "great content with poor CWV can still rank above poor content with excellent CWV".
Google's official documentation states directly: "Page Experience signal affects ranking, but content quality remains a more important factor." CWV is a tiebreaker on equal terms, not an independent ranking driver.
When sites with poor CWV still rank
- Dominant domain authority — Wikipedia, major media outlets, government sites have thousands of backlinks that outweigh poor CWV
- Content uniqueness — if there are only 2–3 quality results for a query, Google has no alternative
- CrUX sample size — if a site doesn't have enough traffic for CrUX, the Page Experience signal doesn't apply at all
Prioritisation depends on the competitive landscape. Check competitors' CWV via PageSpeed Insights before planning work — if everyone is in the yellow zone, being the first to reach Good gives you a real edge.
Where to Start: The Workflow
The most common mistake is trying to fix everything at once. The right approach: measure first, prioritize, then fix and verify the result.
- Check GSC — which page template group is in "Poor" status.
- If multiple metrics are in the red — start with LCP. It most often drags other scores down and has the most direct connection to load time.
- Fix INP second — it requires JS profiling and developer work.
- CLS is usually the quickest fix (image dimensions, ad space reservation) and often doesn't require a backend developer.
After deploying changes — don't check results the next day. CrUX aggregates data over a rolling 28-day window. Real field data won't reflect your changes for at least 28 days post-deployment.
A tested workflow for agencies and developers: note the deployment date and set a reminder for 35 days out (28 + a week for full aggregation). Don't try to watch PSI daily — little changes in the first weeks. CrUX updates weekly, but the window is rolling.
Monitoring tools: Lighthouse CI and DataDog RUM
A one-off PageSpeed Insights check is a diagnostic, not a monitoring strategy. Keeping Core Web Vitals healthy requires continuous tracking — otherwise a single new widget or third-party script can silently push metrics back into the red.
Lighthouse CI integrates into your CI/CD pipeline (GitHub Actions, GitLab CI, Bitbucket Pipelines) and runs automatically on every deployment. You define performance budgets — for example, LCP must stay below 2.5 s and CLS below 0.1 — and the build fails if those thresholds are breached. This catches regressions before they reach production: the most common scenario is a developer adding a carousel plugin that introduces a render-blocking script or accidentally puts loading="lazy" on the hero image.
DataDog Real User Monitoring (RUM) and similar products (Sentry Performance, SpeedCurve, New Relic Browser) collect data from actual users — similar to CrUX but with access to raw events and flexible segmentation. You can compare INP on mid-range Android devices versus desktop, isolate specific page templates with recurring Long Tasks, or monitor how a new JavaScript feature affects interaction latency across different regions. For high-traffic e-commerce sites where a 100 ms increase in INP directly impacts conversion rates, this level of visibility is essential.
Minimum viable monitoring stack: Lighthouse CI in CI/CD (free) + CrUX Dashboard in Looker Studio (free) covers most projects adequately. DataDog RUM or SpeedCurve make sense for sites with 50,000+ monthly visits where metric degradation has a measurable revenue impact.
Practical checklist: what to fix per metric
A reference table for developers and SEO teams. Use it to turn GSC audit findings directly into actionable developer tasks.
| Metric | Most common cause | Priority fix |
|---|---|---|
| LCP | Hero image has no preload or has loading="lazy" | Add rel="preload" + fetchpriority="high", remove lazy from hero |
| LCP | TTFB exceeds 800 ms | Add CDN, enable server-side caching, switch to HTTP/2 |
| LCP | JPEG/PNG images over 500 KB | Convert to WebP or AVIF, add explicit width and height |
| INP | Long Tasks over 200 ms in event handlers | Debounce handlers, break up work with scheduler.yield() |
| INP | Third-party scripts (analytics, chat, pixels) | Defer loading until after load event using requestIdleCallback |
| INP | Heavy computations on the main thread | Move to a Web Worker |
| CLS | Images without explicit dimensions | Add width/height attributes or CSS aspect-ratio |
| CLS | Ad banner with no reserved space | Set min-height on the container before ad loads |
| CLS | Custom fonts without font-display | Add font-display: optional or swap in @font-face |
Frequently Asked Questions
What are Core Web Vitals and why does Google measure them?
Core Web Vitals are three UX metrics: LCP (loading performance), INP (interactivity), and CLS (visual stability). Google uses them as a ranking signal since 2021 — sites with poor scores lose positions in search results.
What is a good LCP score in 2025?
Good LCP is under 2.5 seconds. Between 2.5 and 4 seconds needs improvement. Over 4 seconds is poor. The goal is for 75% of real visitors (per CrUX data) to experience LCP under 2.5s.
How quickly can Core Web Vitals be improved?
Basic fixes (image compression, deferred JS) show results within 1–2 weeks. Deeper improvements through server optimization and critical rendering path work take 1–2 months. CLS issues caused by unsized images can be fixed in days.
Do Core Web Vitals affect conversions?
Yes. Google data shows a 0.1s improvement in LCP increases conversions by about 8% on average. Poor INP scores directly correlate with bounce rates — if a button takes more than 200ms to respond, users leave.
Need technical website optimization?
We'll audit your Core Web Vitals, identify priority fixes, and implement them as part of your SEO strategy. No generic reports — specific developer tasks and measurable results tracked through CrUX.